
QI Tips: Developing a Successful Measurement Strategy
In an improvement project, a measurement strategy gives your team the data to determine whether your changes are, in fact, leading to improvement. After 20 years of coaching teams in quality improvement, we’ve identified three questions that can help you leverage a successful measurement strategy.
Question one: Do you have a “family of measures” that includes outcome measures, process measures and, when helpful, balancing measures?
Over the lifetime of an improvement project, it can be difficult to see improvement in outcome measures—the measures tied to the overall aim of the project. For example, consider an initiative seeking to reduce obesity rates. It can take multiple years for process improvements—such as introducing a new resource to help families learn about the benefits of a healthy diet—to improve an outcome measure like reducing obesity rates. That means that only looking at the outcome measure could cause teams to abandon changes that may actually be working.
Because outcomes measures can take a while to show improvement, teams should also track measures related to the processes they’re working on as part of the improvement effort. These process measures are found closer to where the work gets done and are impacted more quickly. In the case of improving obesity rates, one process measure might be tracking how many families receive the resource during well-child visits. A second one might be that all families with children leave a well-child visit with at least one co-created nutritional goal. In theory, some combination of improved process measures (e.g., number of families receiving resources and setting a nutritional goal) should ultimately improve outcome measures (obesity rates).
Finally, balancing measures help ensure that you’re not improving one part of the system at the expense of another. For example, a balancing measure might look at whether the repeated focus on educating families about the benefits of a healthy diet negatively affected patients’ overall experience, perhaps causing some of them to feel judged or less confident.
Question two: Are you making it easy and practical to collect these measures?
If data collection becomes too complicated, teams might be hesitant to collect and report regularly. Below are six tips to stay on track and reduce the burden of data collection:
- Collect data on five to seven total measures, and no more than ten
- Prioritize measures that improvement teams may already be collecting for other purposes to reduce burden
- Develop an easy-to-use data collection form that integrates with your existing database
- Collect data in real time by incorporating it into a current work activity. For example, if an office is already collecting patient information in a flowsheet, add the relevant item into that flowsheet
- Be sure your data collection plan clearly defines each measure, such as numerator, denominator, plans for displaying the data, sampling methodology and source
- Define roles for ongoing data collection—such as who will collect each measure and who will record each measure—so that all participants understand their responsibilities
Interested in learning more about the fundamentals of quality improvement? Take our 30-minute E-Course, Quality Improvement 101, and discover how to create effective, beneficial change.
Question three: Are you using your data to inform your tests of change by tracking your data over time?
Make sure you can plot your data over time, so you can see the story your data is telling and can identify improvement patterns that might be emerging, such as shifts and trends. Time series graphs, like a line graph or run chart, annotated with changes and other events are the best way to look at your data for the purposes of informing improvement.
For example, consider the process measure that all families with children leave the appointment with at least one co-created goal. At the start of the project you’ve discovered that only 20 percent of families are doing this. Over the next year, you begin to test and implement changes in your practice to help more families set a goal, such as providing new resources, anticipatory guidance, and workshops.
Now, let’s compare two ways to track the process measure.
In scenario one, you measure your success at the end of the project and are thrilled to learn that 75 percent of your families are now setting co-created goals at the end of each well-child visit. You chart this progress in a bar chart, which shows the overall improvement (see chart A), and walk away confident and pleased that your changes have led to an improvement.
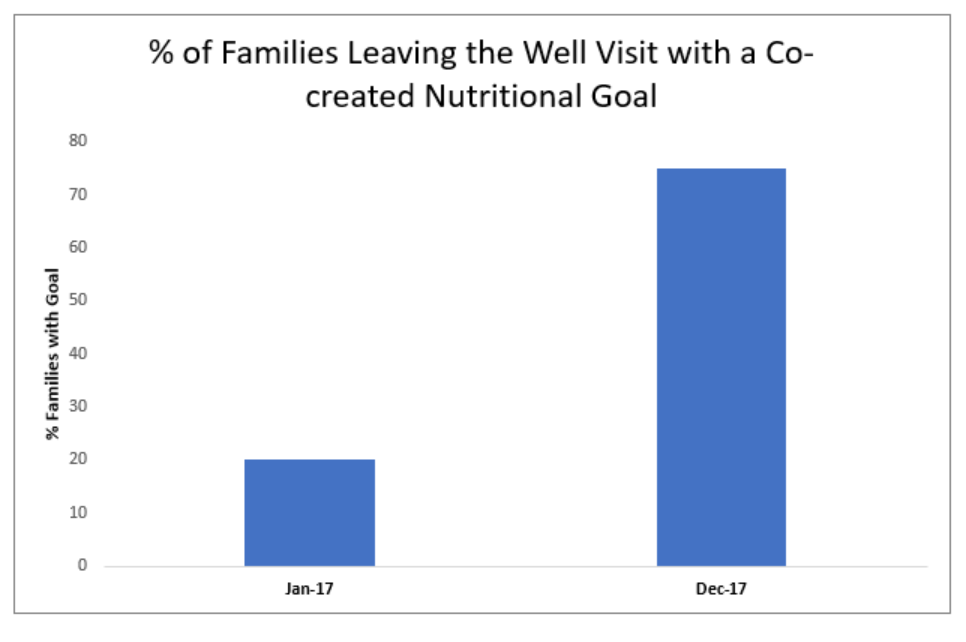 Chart A
Now consider scenario two, where you track your progress month to month in a line chart (see Chart B) and annotate the chart with the changes you have tested over the life the project. This chart shows that the improvement didn’t begin until May, a few months into the initiative and after multiple changes had been tested. This information suggests that changes made near May may have been responsible for the improvement, and that changes earlier in the initiative may not have been as effective. It gives you a more complete picture of your work, prompting you to ask questions about what is and is not working. In contrast, scenario A’s bar chart tells only that you improved, which is a very limited story compared to what’s shown in the monthly data plotted on the run chart.
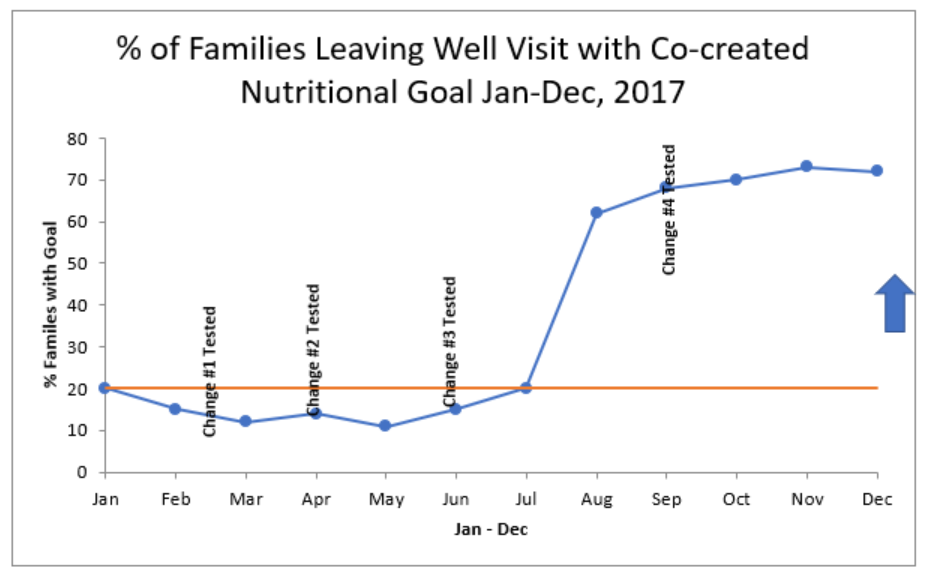 Chart B
Ready to put together your measurement strategy? Use the Measurement Worksheet below to get started. And if you need more resources, here are three other helpful tools:
- Check out this introduction to using control charts, which can help enhance your measurement strategy
- Read this article on using evaluation to guide rather than derail your PDSA cycle, an all too common evaluation pitfall
- If you’ve already taken QI 101, move onto to QI 102, the next step in understanding how change leads to improvement.
Measurement Worksheet
|
|---|