
Raising the Bar on Virtual QI Collaboration
Quality improvement (QI) projects are centered on collaborative learning. Teams accelerate change by engaging in rapid-cycle testing, sharing what works, and then spreading and scaling those successes and lessons-learned across the collaborative.
Facilitating collaboration can be challenging though. Teams are often based in different locations and balancing competing priorities, and funding constraints can make it difficult for teams to meet and engage in shared learning. Often, too, insights shared during individual communications, such as by email or phone, are never spread to others and are ultimately lost to the broader team. The larger the project, the more these challenges are exacerbated.
This is where virtual platforms come into play. The digital space has unmatched potential for engendering collaboration that not only transcends geographic barriers, but also enhances and simplifies QI processes. That’s why, over the past six years, NICHQ has partnered with the web development agency Agaric to develop and enhance the NICHQ Collaboratory (CoLab)—a platform designed specifically to help improvement teams collaborate, innovate, and make change.
“We wanted to create a platform that uniquely supported the central tenets of any QI project—rapid tests of change, collaborative learning, visualizing data using run charts and control charts—but that could be customized to fit the individual needs of each,” says NICHQ Senior Manager of Technology and Business Solutions Matthew Biewener, MPH. “Thanks to Agaric, the CoLab really has become that platform. It has such big implications for QI efforts everywhere, and it’s been great to partner with an organization that shares our commitment to improving the health of communities, and prioritizing equity by ensuring resources to the most vulnerable among us.”
The CoLab includes both a data portal—where teams can collect, report on, and analyze data—and an online community—where teams can post resources and events, ask questions, and share project updates. Together, these two components combine the best of traditional social networks with all the functionality of a file-sharing system and a robust data tracking interface.
Interested in learning more about how a digital platform like the CoLab is raising the bar on virtual QI collaboration? Below, Biewener and Agaric’s user experience designer Clayton Dewey expand on its impact and potential.
Taking teamwork to the next level
The CoLab smooths out some of the most common QI collaboration challenges and enhances the kind of teamwork required on QI projects. For example,
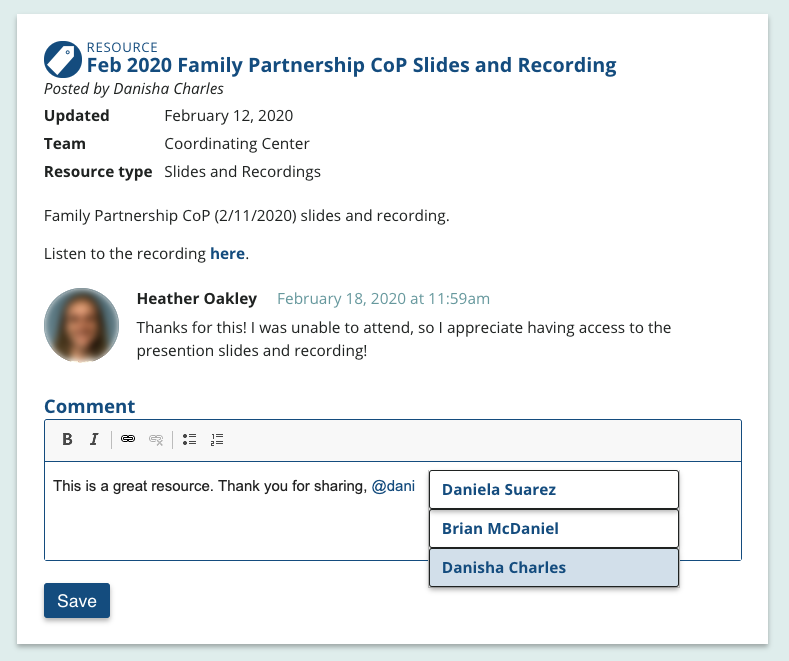
1. Ensures that every conversation counts: When teams aren’t working in the same place (and often even when they are), emails are the predominant mode of communication. And while emails do provide an easy way to communicate quickly, they’re also limited: only the recipients included on the email will see them. Plus, nuggets of information can get lost at the bottom of a lengthy email chain. CoLab’s “mentions” feature works to pull project-related communications out of one-on-one emails and onto the community portal, so that everyone can learn together.
- How it works: Users can share a resource or ask a question and “mention” anyone on the initiative. The “mentionee” then receives an email alerting them to the conversation and can hop on CoLab to reply and/or “mention” others who might be interested in learning with them.
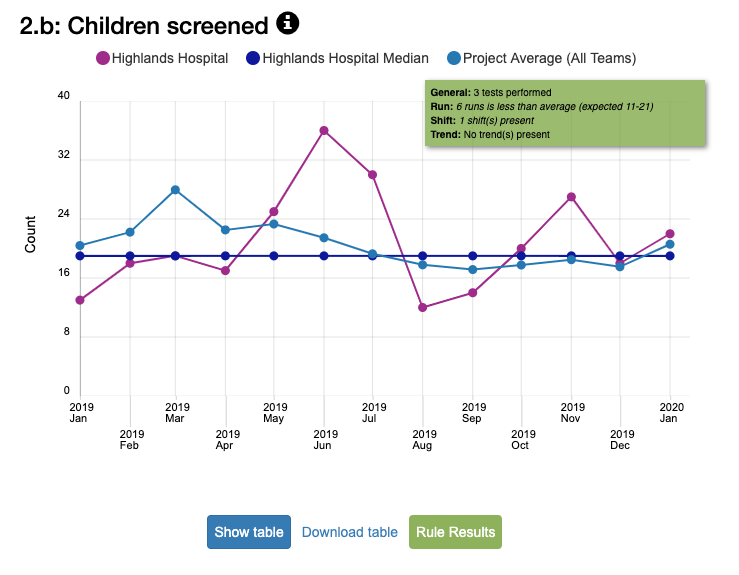
2. Optimizes data sharing: Data helps teams track the success of the changes they make and, when shared collectively, can help all project teams learn together and accelerate improvement. But while one team may look at another’s run chart or data table, that’s often where their engagement stops. CoLab encourages teams to take a deeper dive into each other’s data by making it easy to see the data comprising any particular chart
- How it works: Charts include data tables below them, which can be viewed in a browser, or downloaded as a spreadsheet for further analysis. “It’s an intentional way of breaking down that common sphere of discomfort around sharing and engaging with data,” says Biewener.
3. Encourages peer-to-peer learning: CoLab also makes it easy for someone in a specific team role (e.g., data manager, team lead, or family partner) to engage with people who share that role on another team. This way, users can more easily connect to and learn from those who share their responsibilities and thus likely experience similar challenges.
- How it works: When joining a project’s CoLab, individuals create a personal profile that includes their team (e.g., a specific state or hospital) and their role on that team. Users can then easily find and connect with someone who shares their role, or search for content developed by a particular role, so they can learn collaboratively.
Enhance the PDSA process
Plan-Do-Study-Act (PDSA) cycles are central components to any QI project. Through PDSA cycles, teams test, implement, and spread change ideas in a systematic way. PDSA worksheets help teams document each test of change, track what is leading to improvement, and build on successes. The CoLab enhances the process for submitting PDSA worksheets by:
- Providing a standard PDSA form, which includes instructions on the details and data teams need to supply. Projects can customize the form depending on their particular goals or needs, but the standardized form helps reduce confusion and increase efficiency when the project launches and serves as a valuable teaching tool to hone proposed activities and data collection efforts.
- Capturing those data as structured searchable content. On CoLab, users submit their PDSA data through a form built into the website, instead of submitting that data as a PDF or word document. And since the data is captured directly on the website, as opposed to a PDF, the data are searchable. This means that if a hospital team wants to test a change idea, they can first search for that change idea on CoLab, see whether other teams have tested anything related to it, and then build off those lessons learned.
Making data do-able
Teams can easily get overwhelmed by the amount of data they’re asked to collect on QI projects. That’s why CoLab’s data portal is designed to make it as easy as possible to capture and display quality data. “By co-designing data collection forms with practitioners—the actual users—we made data entry intuitive, rather than frustrating and tedious. This not only makes the work easier; it also improves the quality of the data entered,” explained Dewey.
“We wanted to ensure that teams could easily enter data and then quickly see those data on charts and tables with minimal configuration,” added Biewener. “Reducing the technical burden on our end users is especially crucial for QI projects, where people might have many competing priorities and varying degrees of data literacy.”
CoLab has integrated multiple quality assurance checks, which save time as well as ensure quality. For example, it verifies that data has been entered for all measures before a form is submitted, checks that numerators are not bigger than denominators, and has mechanisms for auto-populating or calculating data submissions based on previous answers. The data submission workflow, which documents when data are in draft form versus considered final, helps with subsequent analysis and interpretation.
Once data are submitted, the CoLab automatically generates corresponding charts, so teams can easily view their progress and learn together.
“We specialize in websites, web apps and other online tools because we’ve seen how it facilitates cooperation on an unprecedented scale. Bringing that collaboration into the digital health space with NICHQ is especially rewarding,” says Dewey.
Interested in more ideas for supporting digital collaboration? Find multiple resources on digital health innovation here.